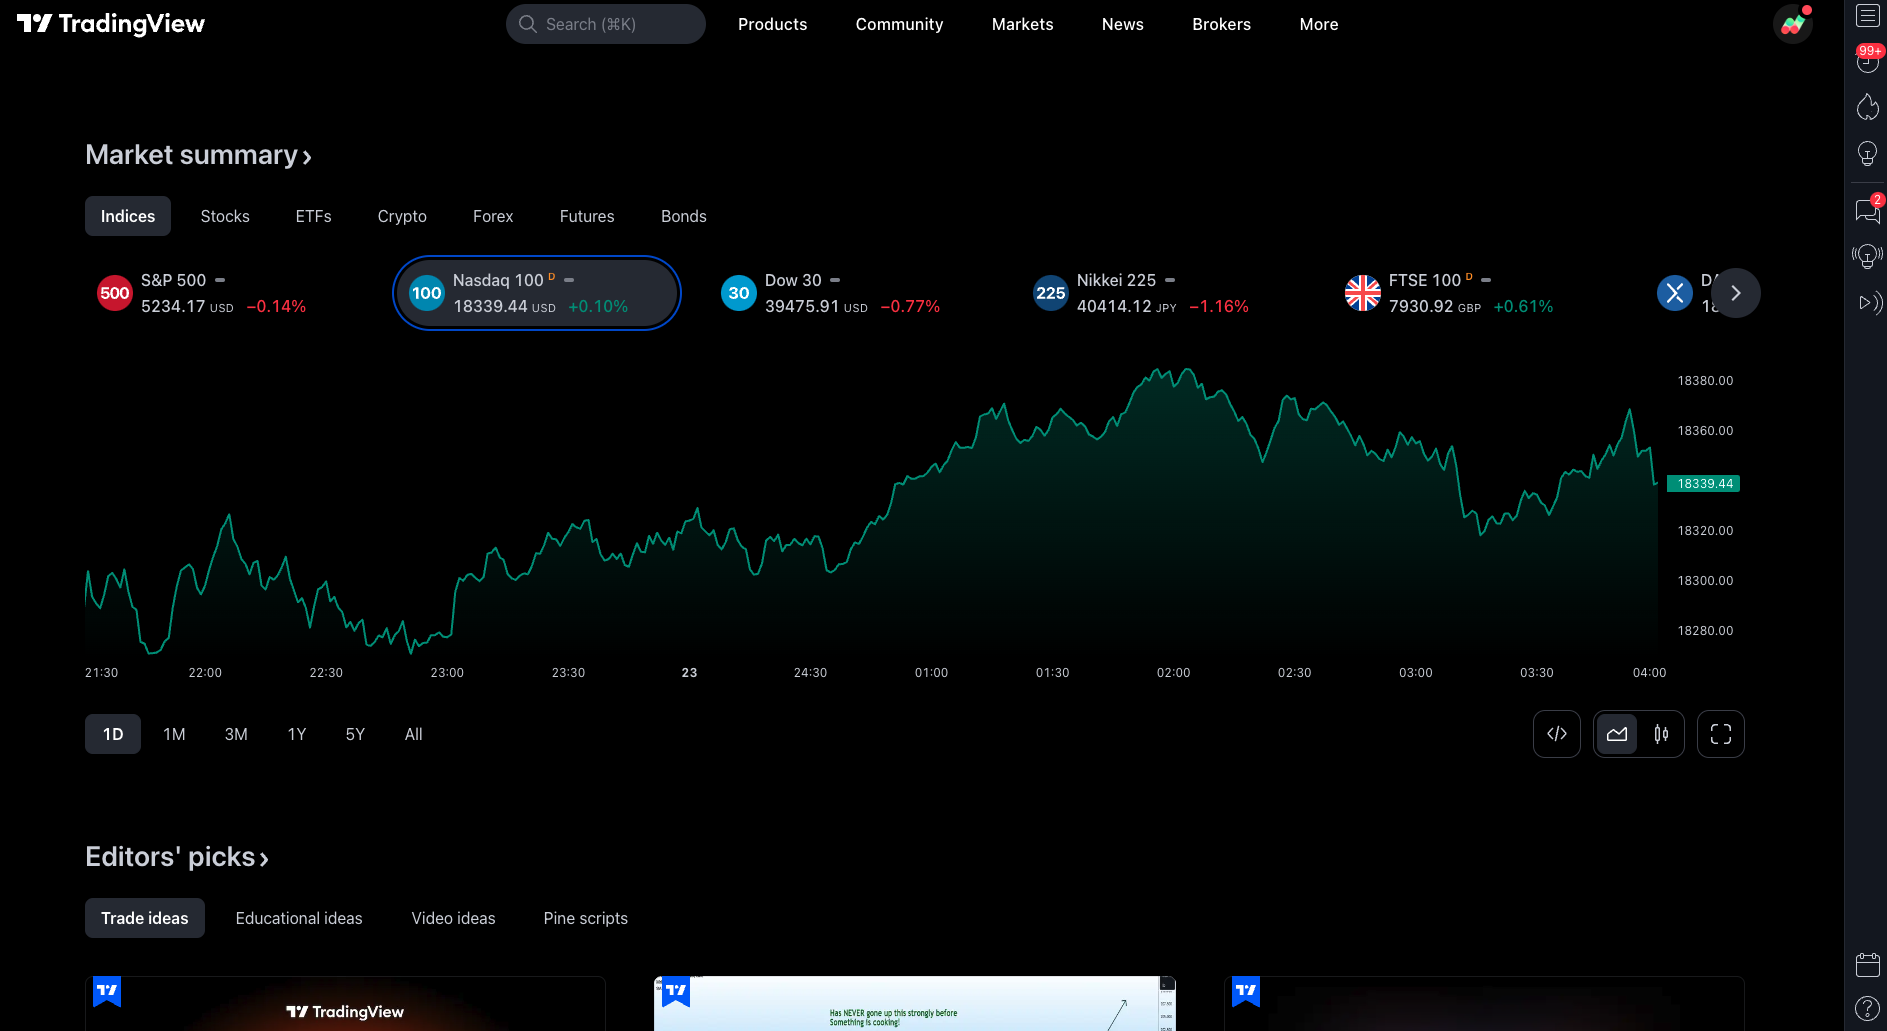
What is TradingView?
TradingView is a powerful online platform that provides traders with advanced charting tools, technical analysis indicators, and a vibrant community of traders. It is designed to help traders analyze market trends across various financial markets.

Getting Started
To get started with TradingView, you need to sign up for a TradingView account. Simply visit the TradingView website and click on the "Sign Up" button. Follow the instructions to create your account and verify your email address.
Basic Features
1. Interactive Charts:
TradingView provides interactive charts with a variety of chart types, timeframes, and drawing tools. You can customize the charts to suit your trading style and preferences.
2. Technical Analysis Indicators:
TradingView offers a vast library of technical analysis indicators that can help you analyze market trends, e.g. RSI, MACD, MA/EMA, BB, which help traders to identify potential entry and exit points, and analyze the market conditions.
3. Watchlists and Alerts:
You can create watchlists of your favorite trading assets and set up alerts to receive notifications when specific conditions are met. This allows you to stay updated on market movements and potential trading opportunities.
4. Chart Layout:
You can create more than one chart layout on TradingView to help you quickly browse through different trading assets. Once you finished setting up the layout, you will have to save your changes. Simply do that by click the "unsaved" button above "Watchlist" to save your layout settings.
Advanced Features
1. Chart Replay:
TradingView allows you to replay the price actions of your selected assets, so you could observe the market movement once again based on the price action playback. It is useful to validate and train your trading strategies. Then you could evaluate the performance of your strategies and make necessary adjustments before implementing them in real-time trading.
2. Technical analysis tools:
TradingView allows you to sketch technical analysis and set risk/reward ratios etc. on the chart easily by using the tools in the sidebar. It assists traders to make better trading decisions by better visualizing the charts.