Optimize Your Chart: A Pro TradeDots Setup
Level up your technical analysis! Using multiple indicators provides a deeper understanding of market dynamics, but a cluttered chart can lead to confusion, not clarity. This guide demonstrates how to optimize your TradingView chart when using a comprehensive suite of TradeDots indicators, ensuring you get maximum insight with minimum noise.
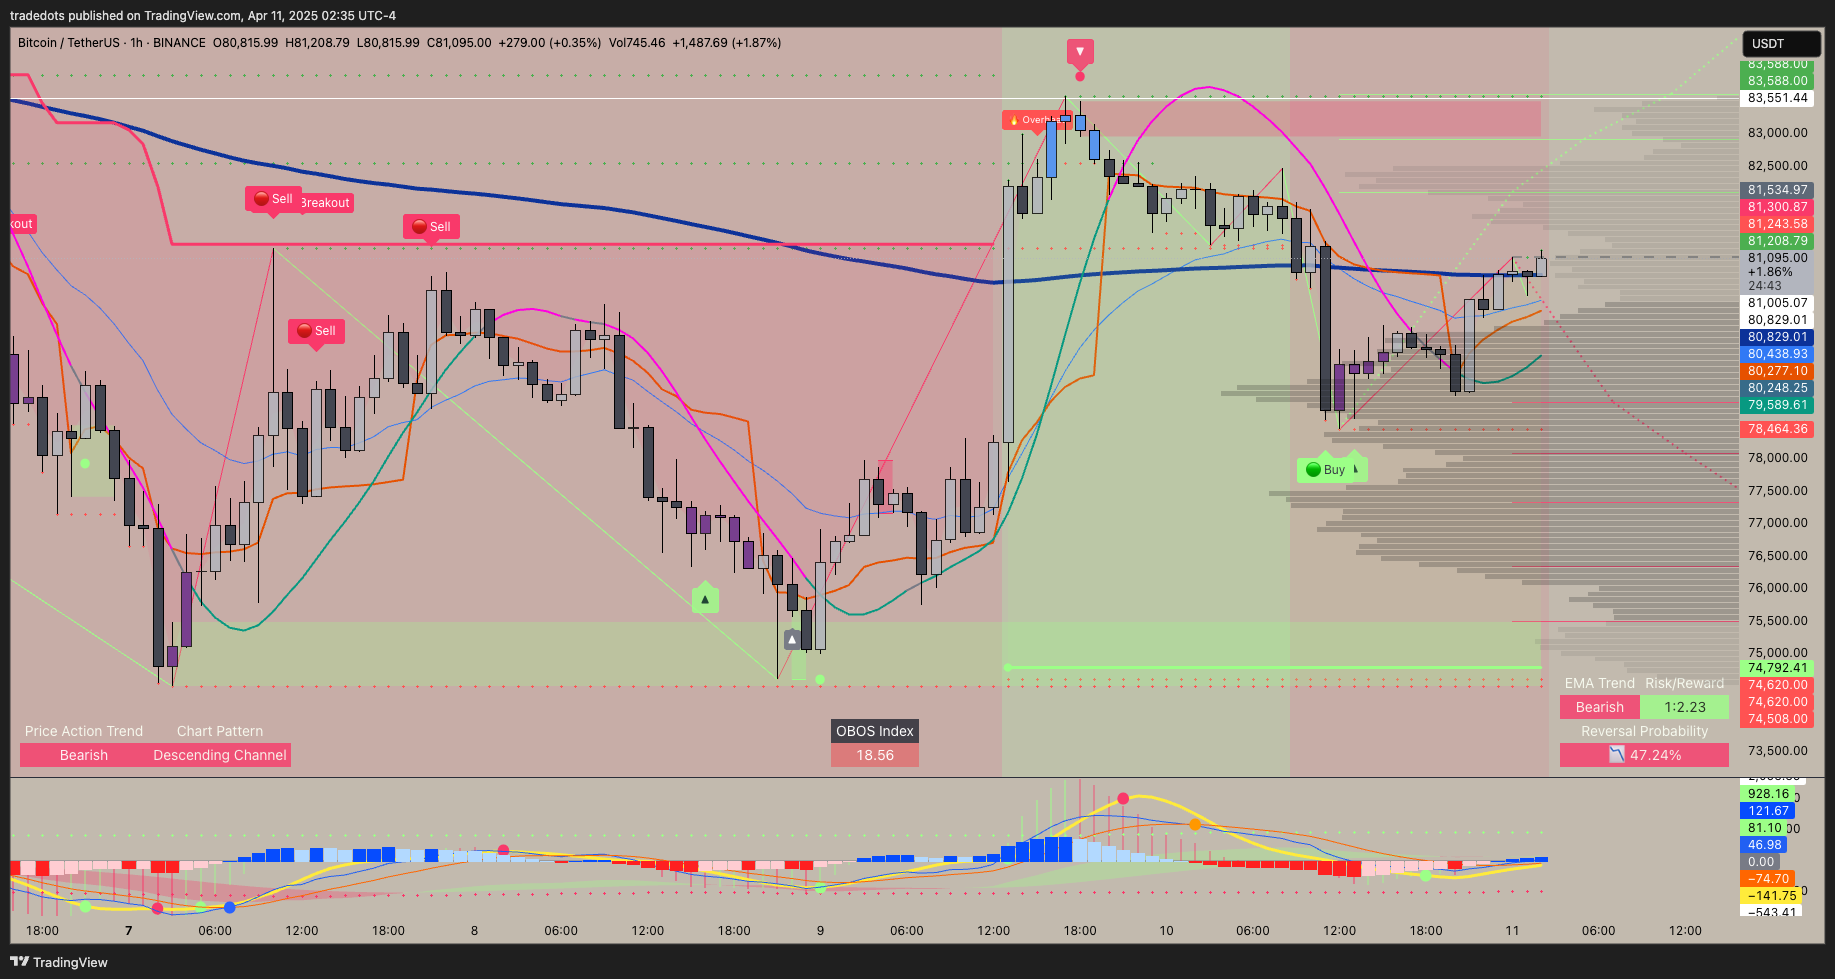
We'll walk through an example setup combining powerful TradeDots tools with standard indicators, focusing on fine-tuning settings for a clean, actionable trading command center.
The Multi-Indicator Stack: An Example Setup
This setup aims for a comprehensive market view, blending trend, momentum, structure, reversals, and key price levels. Adapt it based on your preferred trading style and market.
Core TradeDots Indicators:
- Trend, Chart Patterns & Market Structure Indicator: Your foundation for understanding the market's direction and underlying patterns.
- Price & Momentum Reversal Indicator: Pinpointing potential exhaustion points and momentum shifts.
- Trend Following Buy Sell Signals Pro: Providing clear, actionable entry and exit signals based on trend conditions.
- Smart MACD Reversal Oscillator Pro: A sophisticated momentum oscillator identifying divergences and potential reversals.
- Price Reversal Probability + Price Forecast: Quantifying reversal chances and projecting potential price targets.
Standard Supporting Indicators:
- EMA (20-period): Tracks short-term dynamic support/resistance and momentum.
- EMA (200-period): Identifies the longer-term underlying trend bias.
- Visible Range Volume Profile (VRVP): Highlights significant price levels based on volume, revealing key support/resistance zones.
- Volume Weighted Average Price (VWAP): Crucial for intraday traders to gauge price relative to volume-weighted liquidity. (Often added specifically for day trading sessions).
Why This Combination? Achieving Market Synergy
This combination isn't random; it's designed for synergy. By layering these specific tools, you gain a multi-faceted view:
- Trend & Momentum: Identified by EMAs and confirmed/refined by the Trend Following signals and MACD oscillator.
- Support & Resistance: Pinpointed by Market Structure levels, VRVP high-volume nodes, and potentially dynamic EMAs/VWAP.
- Reversal Opportunities: Flagged by the Price & Momentum, MACD (divergence), and Reversal Probability indicators.
- Actionable Signals: Provided directly by the Buy Sell Signals Pro, contextualized by the other indicators.
This comprehensive analysis framework helps you understand why a signal is occurring and assess its quality within the broader market context, leading to more informed trading decisions.
Fine-Tuning for Crystal Clarity: Key Setting Adjustments
Now, let's declutter. A powerful setup needs clean execution. Here are essential tweaks to reduce visual noise without losing vital information:
-
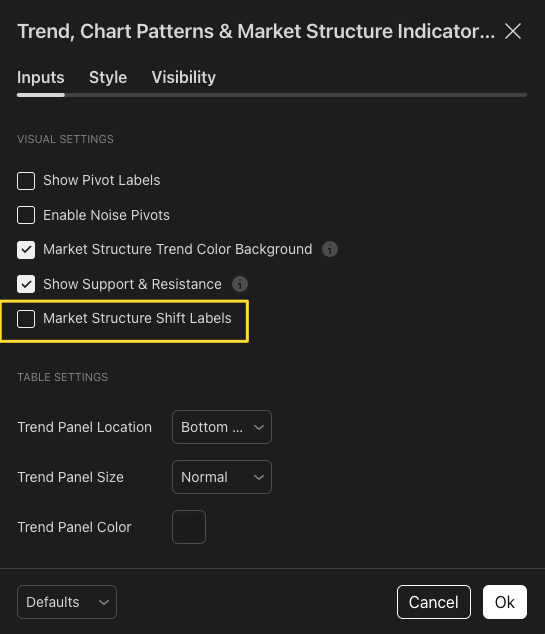
Simplify Market Structure:
- Go to the settings for the
Trend, Chart Patterns & Market Structure Indicator. - Find the option "Market Structure Shift Labels"
- Turn OFF this setting. While valuable, these labels can add clutter in a multi-indicator setup; the change in background color often suffices.
- Go to the settings for the
-
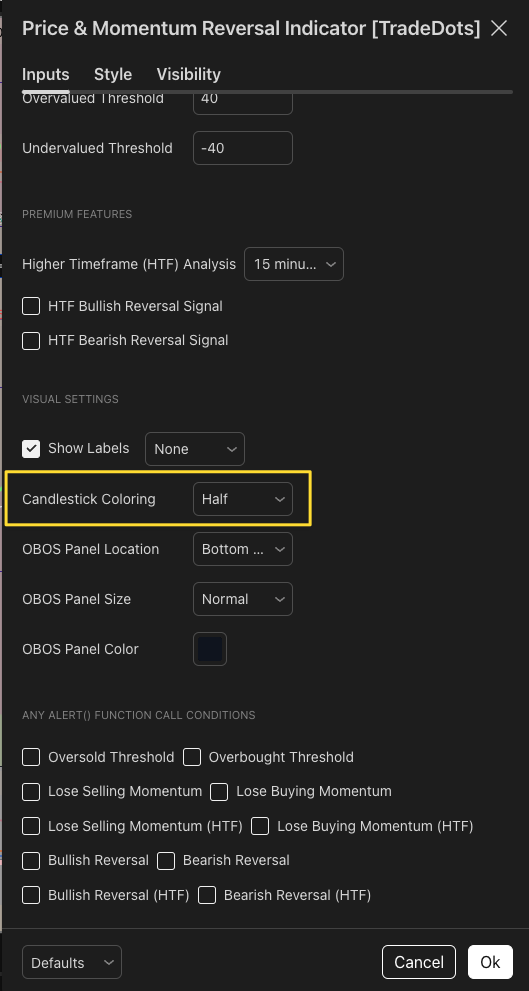
Refine Candlestick Coloring:
- Go to the settings for the
Price & Momentum Reversal Indicator. - Look for the "Candlestick Coloring" option.
- Change the setting from "Full" to "Half". This subtly colors only part of the candle, retaining price action visibility while still indicating momentum shifts.
- Go to the settings for the
-
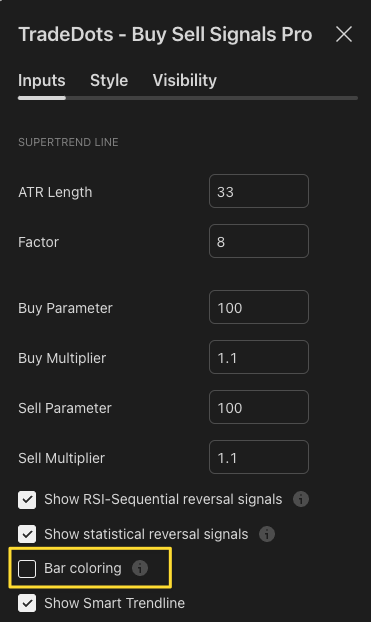
Disable Redundant Bar Coloring:
- Go to the settings for the
Trend Following Buy Sell Signals Proindicator. - Locate the "Bar Coloring" option.
- Turn OFF (uncheck) this feature. Since other indicators (like Price & Momentum) might already provide bar coloring, disabling this prevents visual conflicts and keeps the focus on the primary signals (arrows/dots).
- Go to the settings for the
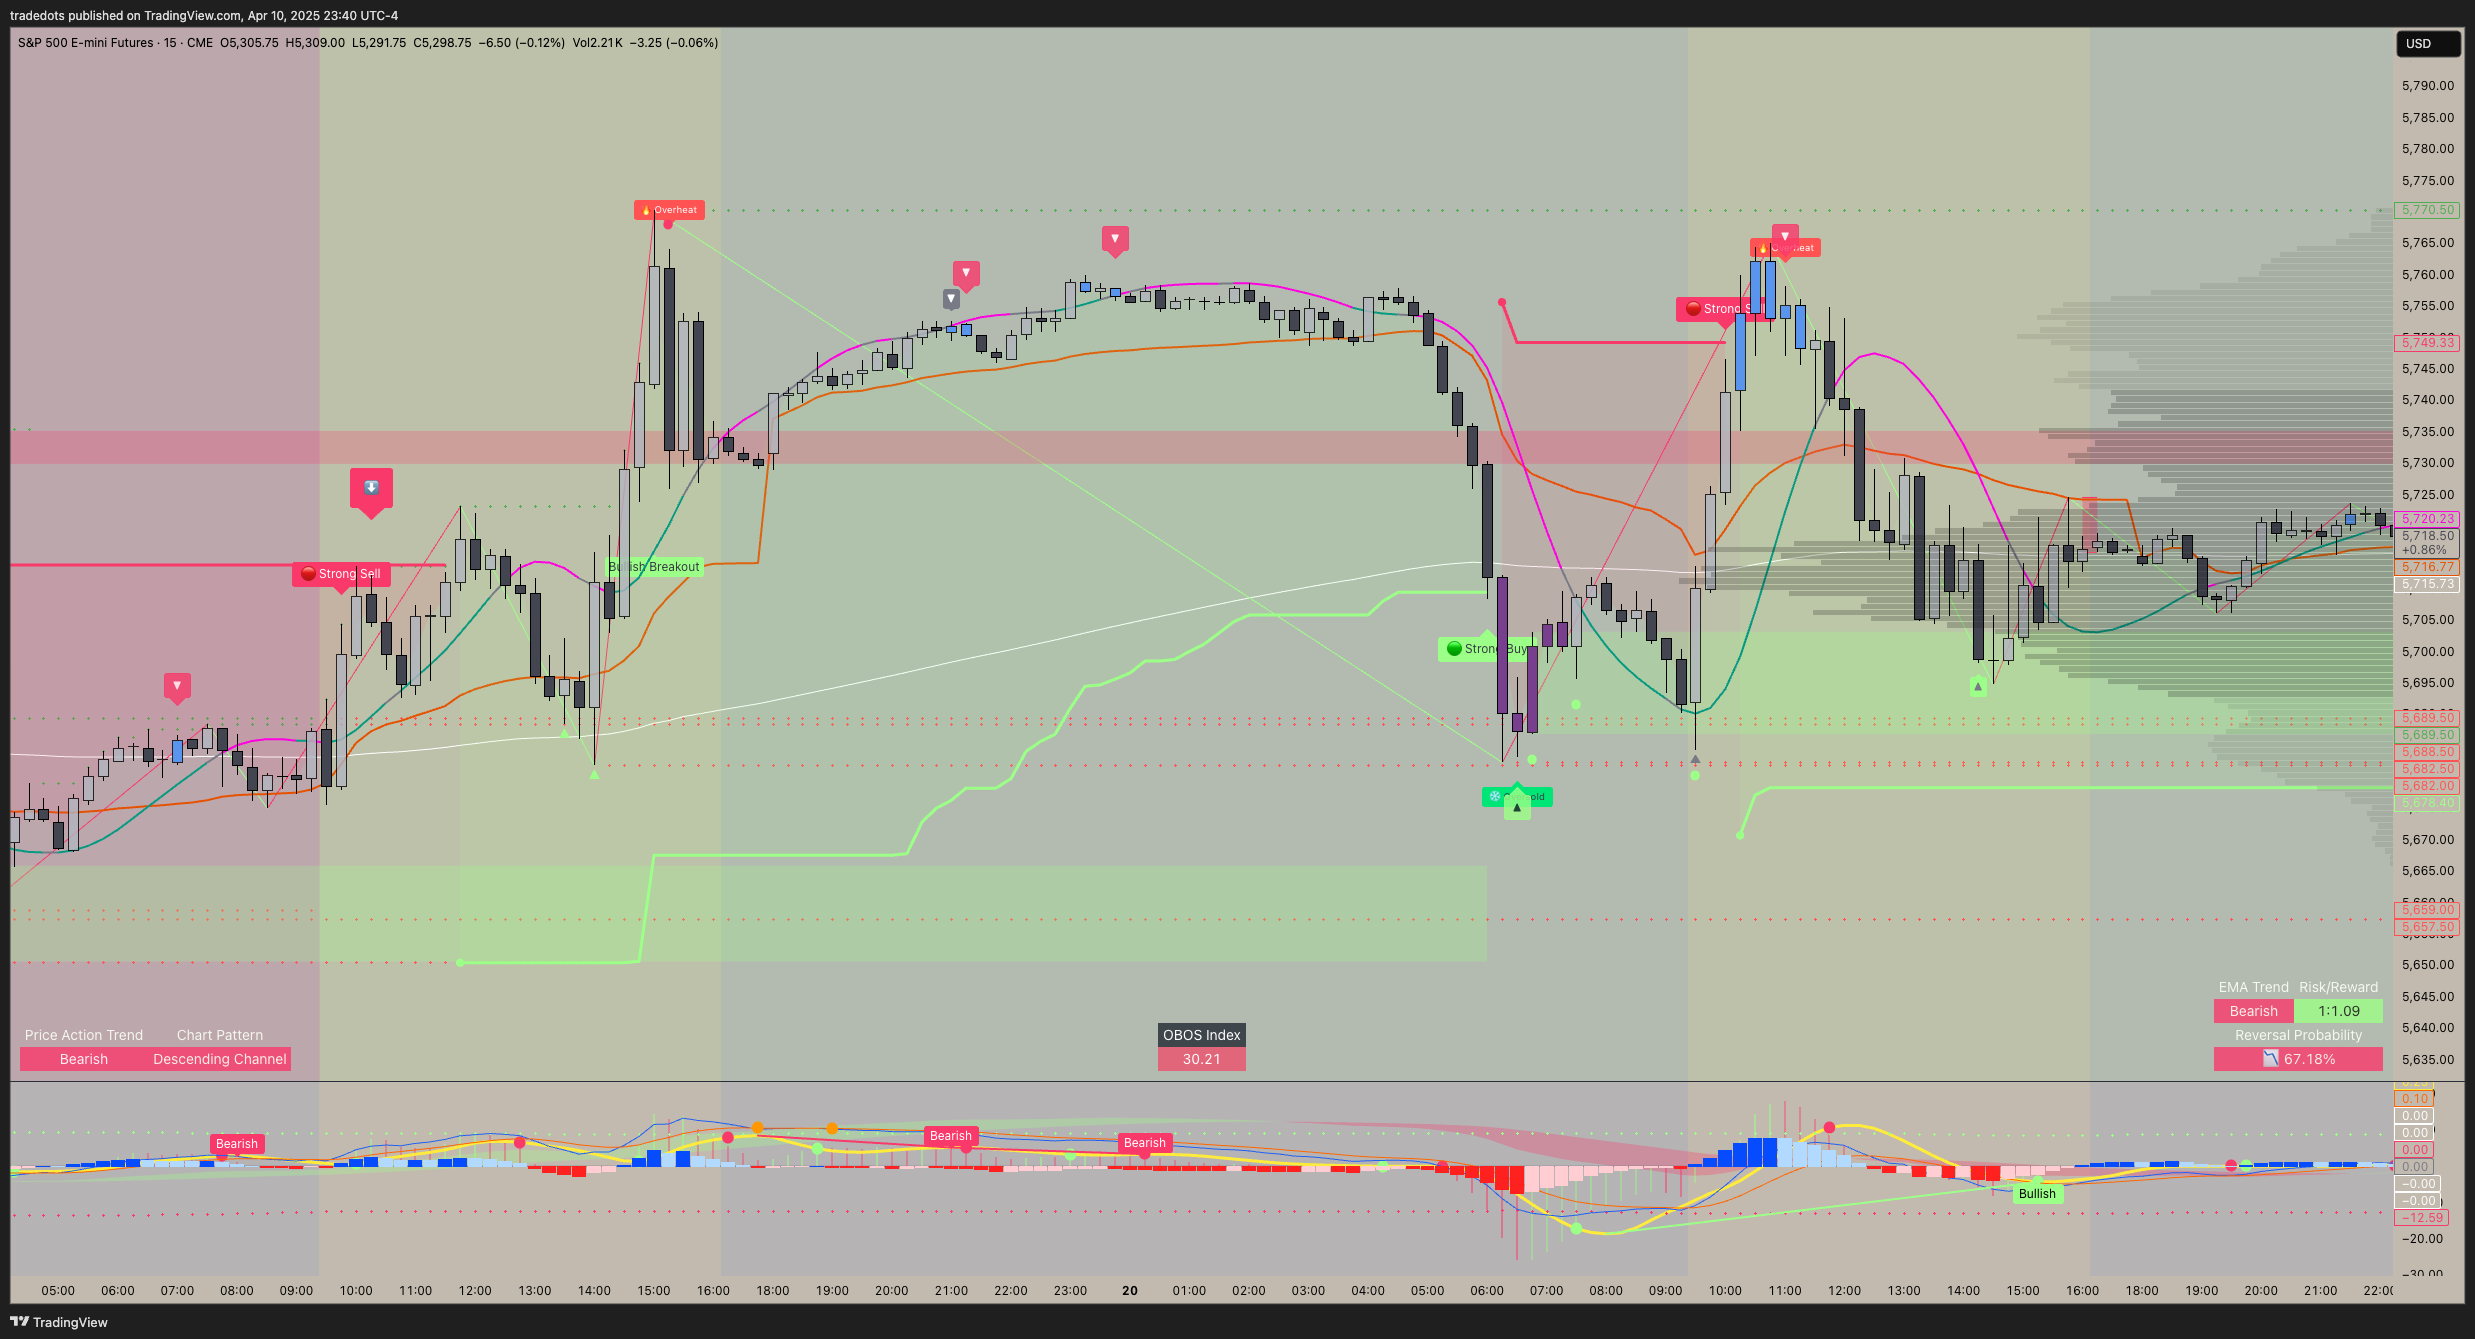
The Result: Your Optimized Trading Command Center
After applying these settings, your chart transforms. Instead of a confusing mess, you should have:
- A clean price action display.
- Key support, resistance, and high-volume zones clearly marked by Market Structure lines and VRVP.
- Underlying trend context from the EMAs.
- Non-intrusive momentum insights from the half-bar coloring and MACD oscillator (likely in a separate pane).
- Clear, distinct Buy/Sell signals from the Trend Following indicator.
- Reversal probability insights without overwhelming the main chart.
This optimized chart setup allows you to quickly assess market conditions, identify high-probability opportunities flagged by your TradeDots indicators, and trade with greater confidence and precision. Remember to save your chart layout as a template in TradingView for easy access!